Reporters
Simple Reporter
Out of the box, Testplane writes the following summary to the console:
Total: 1812 Passed: 1792 Failed: 0 Skipped: 20 Retries: 47
Stats Reporter
If you add the stat-reporter plugin to your project, you will get a more detailed report of the run results in the console after completing all the tests. For example:
┌──────────────────────┬────────┬───────┬────────┬────────┬─────────┬─────────┬──────────┐
│ Browser │ Status │ Tests │ Passed │ Failed │ Skipped │ Retries │ Duration │
├──────────────────────┼────────┼───────┼────────┼────────┼─────────┼─────────┼──────────┤
│ firefox │ passed │ 25 │ 24 │ 0 │ 1 │ 0 │ 01:02 │
├──────────────────────┼────────┼───────┼────────┼────────┼─────────┼─────────┼──────────┤
│ chrome-desktop │ passed │ 466 │ 464 │ 0 │ 2 │ 4 │ 07:40 │
├──────────────────────┼────────┼───────┼────────┼────────┼─────────┼─────────┼──────────┤
│ ipad │ passed │ 24 │ 23 │ 0 │ 1 │ 0 │ 01:27 │
├────────────────────�──┼────────┼───────┼────────┼────────┼─────────┼─────────┼──────────┤
│ iphone │ passed │ 376 │ 372 │ 0 │ 4 │ 7 │ 07:12 │
├──────────────────────┼────────┼───────┼────────┼────────┼─────────┼─────────┼──────────┤
│ chrome-phone │ passed │ 427 │ 421 │ 0 │ 6 │ 14 │ 07:32 │
├──────────────────────┼────────┼───────┼────────┼────────┼─────────┼─────────┼──────────┤
│ iphone-dark │ passed │ 74 │ 72 │ 0 │ 2 │ 4 │ 02:18 │
├──────────────────────┼────────┼───────┼────────┼────────┼─────────┼─────────┼──────────┤
│ searchapp-phone │ passed │ 319 │ 317 │ 0 │ 2 │ 9 │ 10:00 │
├──────────────────────┼────────┼───────┼────────┼────────┼─────────┼─────────┼──────────┤
│ safari13 │ passed │ 15 │ 13 │ 0 │ 2 │ 4 │ 02:42 │
├──────────────────────┼────────┼───────┼────────┼────────┼─────────┼─────────┼──────────┤
│ chrome-desktop-1920 │ passed │ 3 │ 3 │ 0 │ 0 │ 0 │ 00:57 │
├──────────────────────┼────────┼───────┼────────┼────────┼─────────┼─────────┼──────────┤
│ iphoneX │ passed │ 3 │ 3 │ 0 │ 0 │ 0 │ 00:36 │
├──────────────────────┼────────┼───────┼────────┼────────┼─────────┼─────────┼──────────┤
│ chrome-desktop-dark │ passed │ 77 │ 77 │ 0 │ 0 │ 5 │ 01:33 │
├──────────────────────┼────────┼───────┼────────┼────────┼─────────┼─────────┼──────────┤
│ yandex-browser-phone │ passed │ 1 │ 1 │ 0 │ 0 │ 0 │ 00:28 │
├──────────────────────┼────────┼───────┼────────┼────────┼─────────┼─────────┼──────────┤
│ chrome-grid-720 │ passed │ 2 │ 2 │ 0 │ 0 │ 0 │ 00:49 │
└──────────────────────┴────────┴───────┴────────┴────────┴─────────┴─────────┴──────────┘
Unlike the simple reporter, the stat-reporter plugin report breaks down the results by browser. It also displays the maximum execution time (Duration) in minutes and seconds and the test run result (Status) in each browser.
Such a report allows for a better understanding of which browsers encountered problems, specifically: where the most tests failed or the execution time sharply increased.
The stat-reporter plugin also allows generating reports in HTML or JSON formats. See details in the plugin description.
However, in terms of capabilities, the stat-reporter plugin is significantly inferior to the html-reporter plugin, which provides much more advanced ways to work with tests and their run results.
JSON Reporter
Install the json-reporter plugin to get a JSON report with test results in the following format:
{
    "Main Page should send correct headers.chrome-138": {
        "suitePath": ["Main Page", "should send correct headers"],
        "fullName": "Main Page should send correct headers",
        "browserId": "chrome-138",
        "file": "tests/main-page/headers.testplane.js",
        "duration": 2539,
        "meta": {
            "pid": 32410,
            "browserVersion": "138.0",
            "testXReqId": "e96e1911-db41-44a2-9980-fe78f16bb6b4",
            "url": "https://ya.ru/"
        },
        "startTime": 1766063685666,
        "url": "/",
        "status": "fail",
        "errorReason": {
            "message": "Cannot read properties of undefined (reading 'headers')",
            "stack": "TypeError: Cannot read properties of undefined (reading 'headers')\n    at Object.<anonymous> (/dev/hermione-playground/tests/main-page/headers.testplane.js:69:26)\n    at process.processTicksAndRejections (node:internal/process/task_queues:105:5)"
        },
        "retries": []
    }
}
HTML Reporter
Testplane's HTML Reporter is an ever-evolving, sleek and feature-packed UI for analyzing test results. It allows you to:
- filter tests by completion status;
- group tests by errors or any parameter from the test metadata;
- view screenshot differences in 6 different ways;
- view all retries or errors in tests separately.
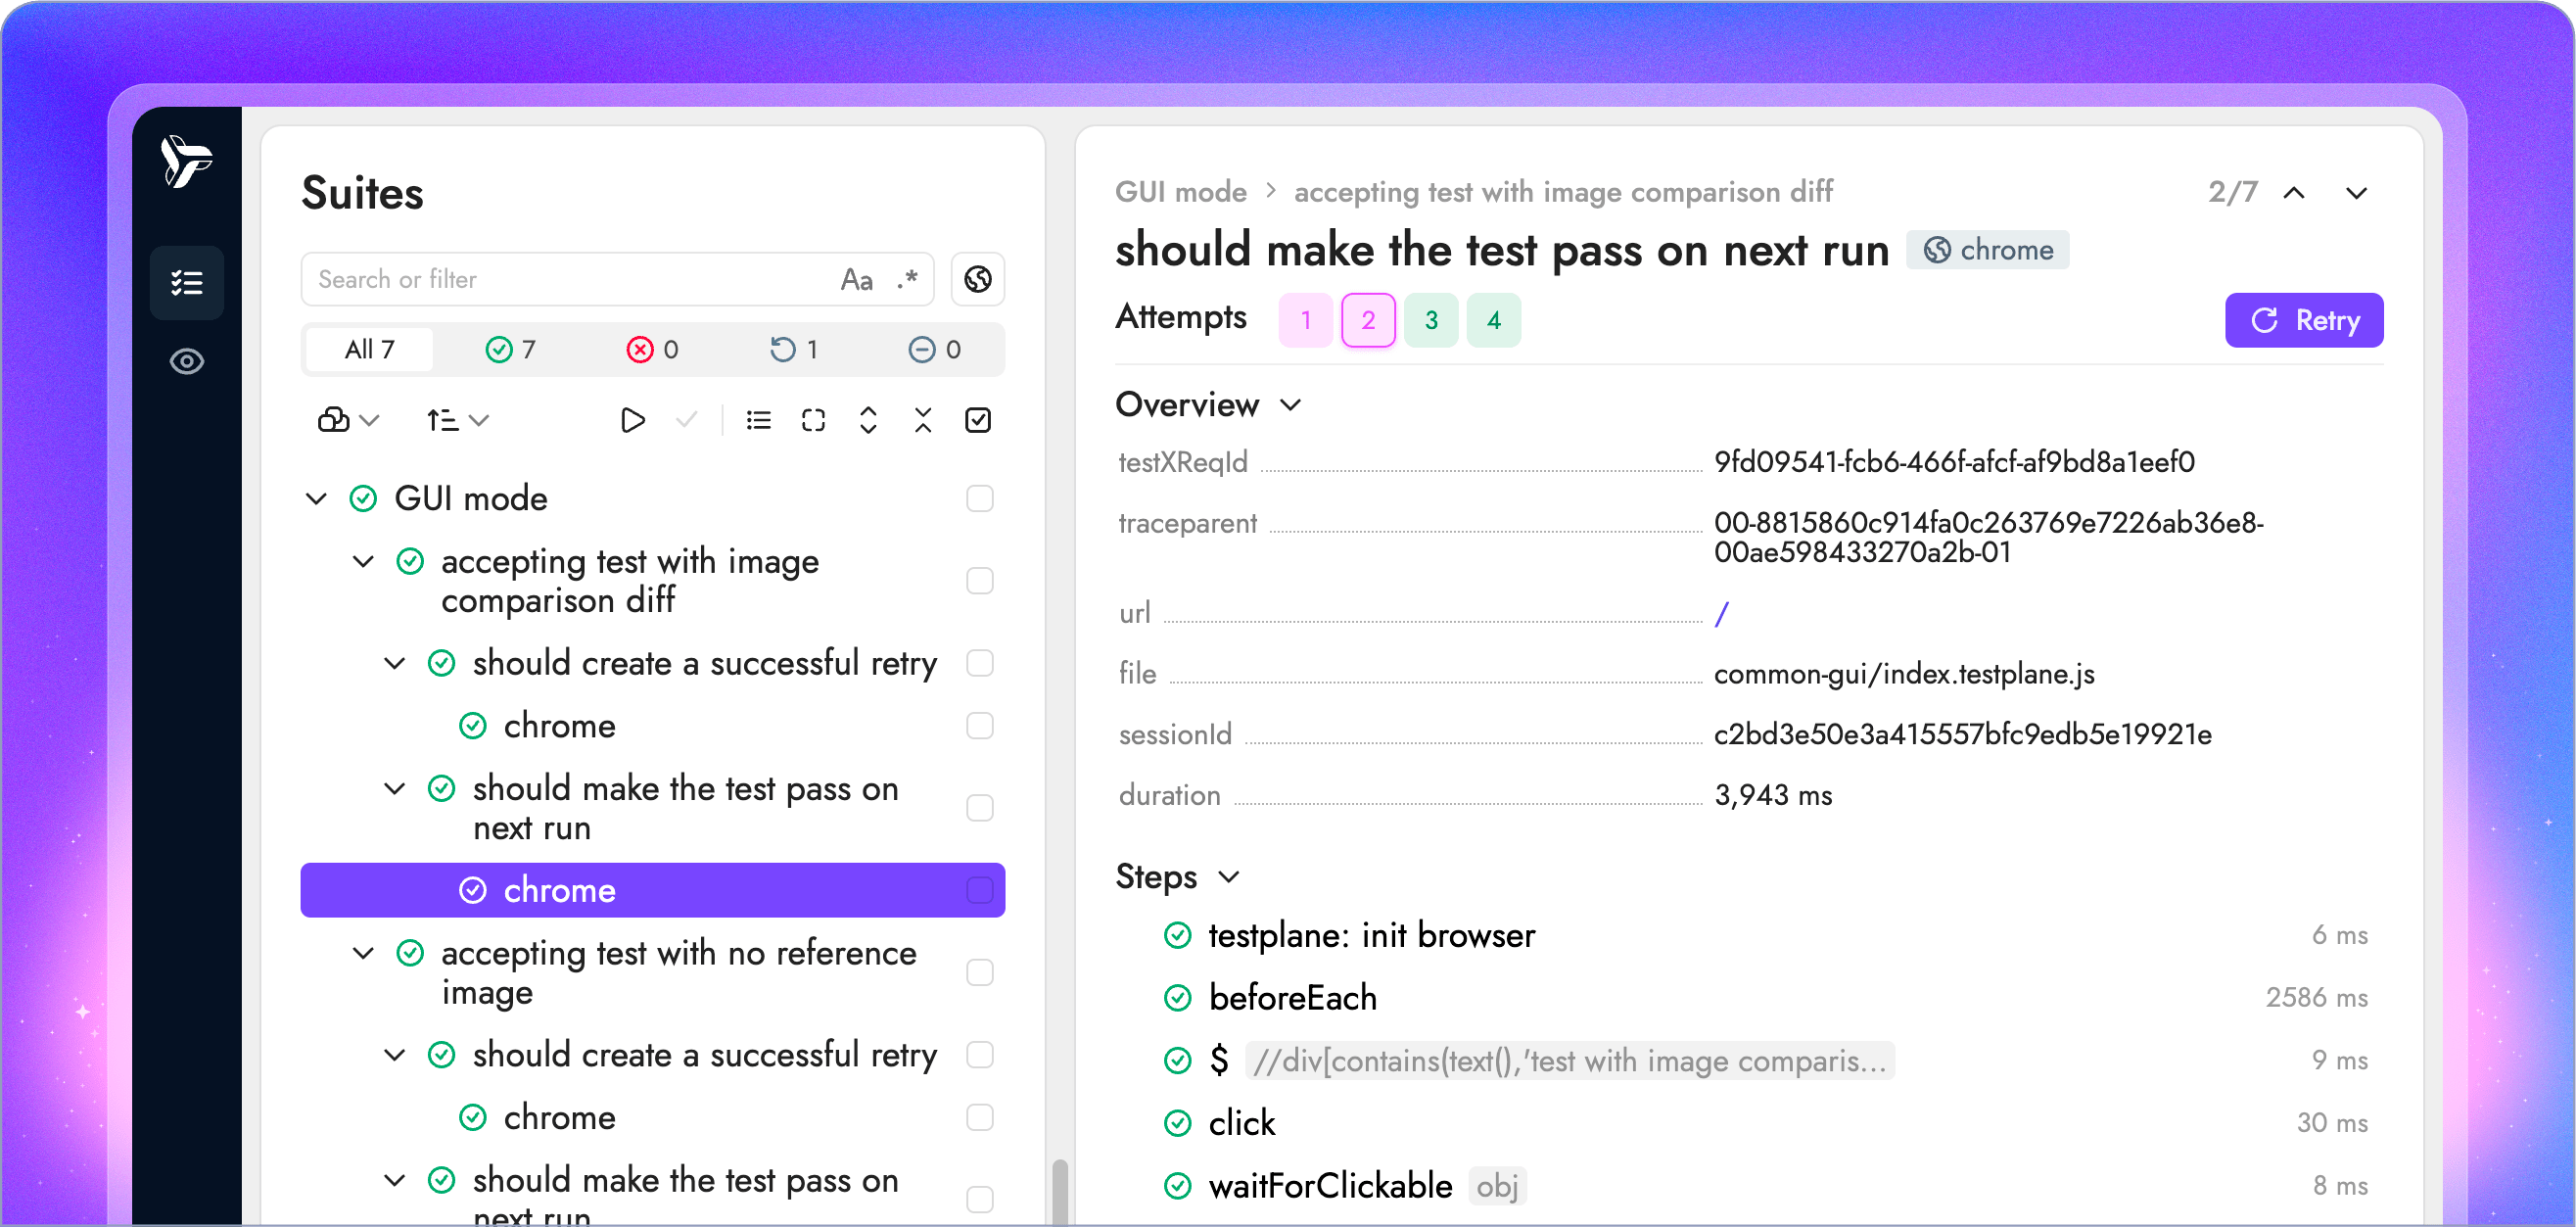
Besides static reports, HTML Reporter has an interactive GUI mode, letting you run your tests, work with visual checks and much more. Learn more about Testplane UI in the dedicated docs section.
Building Your Own
Testplane is highly customizable by design, allowing you to build your own plugins and reporters for your specific needs.
Here's what a basic reporter might look like:
import fs from "fs";
import type Testplane from "testplane";
import type { TestResult } from "testplane";

interface ReporterConfig {
    enabled?: boolean;
    path?: string;
}

interface TestInfo {
    name: string;
    status: string;
}

export = (testplane: Testplane, opts: ReporterConfig = {}): void => {
    if (testplane.isWorker()) return;

    const config = {
        enabled: opts.enabled !== false,
        path: opts.path || "test-results.json",
    };

    if (!config.enabled) return;

    const results: TestInfo[] = [];

    testplane.on(testplane.events.TEST_PASS, (test: TestResult) => {
        results.push({ name: test.fullTitle(), status: "passed" });
    });

    testplane.on(testplane.events.TEST_FAIL, (test: TestResult) => {
        results.push({ name: test.fullTitle(), status: "failed" });
    });

    testplane.on(testplane.events.RUNNER_END, () => {
        fs.writeFileSync(config.path, JSON.stringify(results, null, 2));
        console.log(`✓ Saved ${results.length} test results to ${config.path}`);
    });
};
To use your custom reporter, you need to add it to the testplane.config.ts file:
export default {
    plugins: {
        "./my-reporter": {
            enabled: true,
            path: "./reports/my-results.json",
        },
    },
};
Keywords
- stat-reporter
- json-reporter
- html-reporter
- gui